- Queries
- All Stories
- Search
- Advanced Search
- Transactions
- Transaction Logs
Advanced Search
Jun 10 2021
- configuration of the swh-search and journal clients services deployed
- Old node decommissionning on the cluster:
export ES_NODE=192.168.100.86:9200
curl -H "Content-Type: application/json" -XPUT http://${ES_NODE}/_cluster/settings\?pretty -d '{
    "transient" : {
        "cluster.routing.allocation.exclude._ip" : "192.168.100.81,192.168.100.82,192.168.100.83"
    }
}'
{
  "acknowledged" : true,
  "persistent" : { },
  "transient" : {
    "cluster" : {
      "routing" : {
        "allocation" : {
          "exclude" : {
            "_ip" : "192.168.100.81,192.168.100.82,192.168.100.83"
          }
        }
      }
    }
  }
}
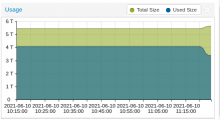
The shards start to be gently moved from the old servers:
curl -s http://search-esnode4:9200/_cat/allocation\?s\=host\&v                                                                        10:22:58
shards disk.indices disk.used disk.avail disk.total disk.percent host           ip             node
    27       38.7gb    38.8gb    153.7gb    192.6gb           20 192.168.100.81 192.168.100.81 search-esnode1
    27       37.7gb    37.8gb    154.8gb    192.6gb           19 192.168.100.82 192.168.100.82 search-esnode2
    22       30.5gb    30.6gb      162gb    192.6gb           15 192.168.100.83 192.168.100.83 search-esnode3
    35         50gb    50.1gb      6.6tb      6.7tb            0 192.168.100.86 192.168.100.86 search-esnode4
    35         50gb    50.2gb      6.6tb      6.7tb            0 192.168.100.87 192.168.100.87 search-esnode5
    34       49.4gb    49.5gb      6.6tb      6.7tb            0 192.168.100.88 192.168.100.88 search-esnode6
When they will be no shards on the old servers, we will be able to stop them and remove them from the proxmox server.
Jun 9 2021
And all the new nodes are now in the production cluster:
curl -s http://search\-esnode4:9200/_cat/allocation\?s\=host\&v                                                                35m 9s 18:47:23
shards disk.indices disk.used disk.avail disk.total disk.percent host           ip             node
    30       42.7gb    42.9gb    149.7gb    192.6gb           22 192.168.100.81 192.168.100.81 search-esnode1
    30       41.4gb    41.6gb      151gb    192.6gb           21 192.168.100.82 192.168.100.82 search-esnode2
    30       41.7gb    41.8gb    150.8gb    192.6gb           21 192.168.100.83 192.168.100.83 search-esnode3
    30       41.9gb      42gb      6.6tb      6.7tb            0 192.168.100.86 192.168.100.86 search-esnode4
    30       41.8gb    41.9gb      6.6tb      6.7tb            0 192.168.100.87 192.168.100.87 search-esnode5
    30       41.2gb    41.3gb      6.6tb      6.7tb            0 192.168.100.88 192.168.100.88 search-esnode6
The next step will be to switch the swh-search configurations to use the new nodes and progressively remove the old nodes from the cluster.
- zfs installation:
root@search-esnode4:~# apt update && apt install linux-image-amd64 linux-headers-amd64
root@search-esnode4:~# shutdown -r now  # to apply the kernel
root@search-esnode4:~# apt install libnvpair1linux libuutil1linux libzfs2linux libzpool2linux zfs-dkms zfsutils-linux zfs-zed
- refresh with the last packages installed from backports
root@search-esnode4:~# apt dist-upgrade # trigger a udev upgrade which leads to a network interface renaming
root@search-esnode4:~# sed -i 's/ens1/enp2s0/g' /etc/network/interfaces
- pre zfs configuration actions:
root@search-esnode4:~# puppet agent --disable
root@search-esnode4:~# systemctl disable elasticsearch
root@search-esnode4:~# systemctl stop elasticsearch
root@search-esnode4:~# rm -rf /srv/elasticsearch/nodes
- To manage the disks via zfs, the raid card needed to be configured in enhanced HBA mode in the idrac
- after a rebbot, the disks are well detected by the system:
root@search-esnode4:~# ls -al /dev/sd*
brw-rw---- 1 root disk 8,  0 Jun  9 04:54 /dev/sda
brw-rw---- 1 root disk 8, 16 Jun  9 04:54 /dev/sdb
brw-rw---- 1 root disk 8, 32 Jun  9 04:54 /dev/sdc
brw-rw---- 1 root disk 8, 48 Jun  9 04:54 /dev/sdd
brw-rw---- 1 root disk 8, 64 Jun  9 04:54 /dev/sde
brw-rw---- 1 root disk 8, 80 Jun  9 04:54 /dev/sdf
brw-rw---- 1 root disk 8, 96 Jun  9 04:54 /dev/sdg
brw-rw---- 1 root disk 8, 97 Jun  9 04:54 /dev/sdg1
brw-rw---- 1 root disk 8, 98 Jun  9 04:54 /dev/sdg2
brw-rw---- 1 root disk 8, 99 Jun  9 04:54 /dev/sdg3
root@search-esnode4:~# smartctl -a /dev/sda
smartctl 6.6 2017-11-05 r4594 [x86_64-linux-4.19.0-16-amd64] (local build)
Copyright (C) 2002-17, Bruce Allen, Christian Franke, www.smartmontools.org
Jun 8 2021
Jun 4 2021
Jun 3 2021
I played with grid5000 to experiment how the jobs work and how to initialize the reserved nodes.
lgtm
Jun 2 2021
- The fix was deployed on webapp1 and moma
- The refresh script was manually launched:
root@webapp1:~# /usr/local/bin/refresh-savecodenow-statuses
Successfully updated 140 save request(s).
The previous requests were correctly refreshed and are now displaying the right status.
Will be deployed with version v0.0.310 of the webapp (build in progress)
fix typo in commit message
Jun 1 2021
May 28 2021
The OPNsense firewall configuration was finalized based on the initial configuration olasd has previously done on the OPNsense firewalls.
May 27 2021
The save code now queue statistics are now displayed on the status.io page[1] as an example. The data are refreshed each 5 minutes.
May 26 2021
update python script:
- remove some prints
- add missing types
- use dict access instead of get
May 25 2021
The servers should be installed on the rack the 26th May. The network configuration will follow the same day or next day.
They will be installed as it by the "DSI" so we will have to install the system via the iDRAC when they will be reachable.
With a master declared in the dns, everything seems to work well.
when the docker command is launched on a node, it's status is well detected and the node is correctly configured after a couple of minute.
The cluster explorer is also working now.
Metrics can easily be pushed to the status page.
The simple poc for the save code now request is available here : https://forge.softwareheritage.org/source/snippets/browse/master/sysadmin/status.io/update_metrics.py
May 20 2021
The basic installation with helm is simple for a mono server installation: https://rancher.com/docs/rancher/v2.5/en/installation/install-rancher-on-k8s/#install-the-rancher-helm-chart
for the status.swh.org point of view, status.io is providing some api endpoint to push metrics. It should be possible to add some metrics (up to 10 with our plan) to expose the behavior of the platform (daily/weekly and monthly statistics).
As a first step, we could expose the number of pending save code now requests and the number of origin visits to have some live data. An example of a status page with metrics : https://status.docker.com/
I'm working on a code snippet to test the integration feasibility/complexity.
great simplification ! thanks
LGTM
May 19 2021
After some hard time with vagrant internal and pergamon configuration, we finally have a puppet master working.
The collected resources are well detected and applied, for example here, with the logstash0's incinga resources :
Notice: /Stage[main]/Profile::Icinga2::Master/Icinga2::Object::Host[pergamon.softwareheritage.org]/Icinga2::Object[icinga2::object::Host::pergamon.softwareheritage.org]/Concat[/etc/icinga2/zones.d/master/pergamon.softwareheritage.org.conf]/File[/etc/icinga2/zones.d/master/pergamon.softwareheritage.org.conf]/ensure: defined content as '{md5}e98c7cafc5300df8101f591d1c7a708b'
Info: Concat[/etc/icinga2/zones.d/master/pergamon.softwareheritage.org.conf]: Scheduling refresh of Class[Icinga2::Service]
Notice: /Stage[main]/Profile::Grafana::Vhost/Icinga2::Object::Service[grafana http redirect on pergamon.softwareheritage.org]/Icinga2::Object[icinga2::object::Service::grafana http redirect on pergamon.softwareheritage.org]/Concat[/etc/icinga2/zones.d/master/exported-checks.conf]/File[/etc/icinga2/zones.d/master/exported-checks.conf]/content:
May 18 2021
and the build is green ;)
thanks for having investigated that
May 17 2021
May 12 2021
May 11 2021
May 10 2021
Theses errors will be caught by the alert created in T3222

