The ELK stack need a good refresh form the 7.8.0 to the 7.15.1
The following component needs to be update:
- elasticsearch
- logstash
- filebeat
- T3545: journalbeat
The ELK stack need a good refresh form the 7.8.0 to the 7.15.1
The following component needs to be update:
| rSPSITE puppet-swh-site | |||
| D6665 | rSPSITEae1e994eabc5 logstash: rename syslog facility to facility_name when it's a string | ||
| D6659 | rSPSITE53eef5fef7fc logstash: puppetize the main logstash configuration file | ||
| D6657 | rSPSITE111a99210f1a logstash: puppetize the closed indexes management script | ||
| D6635 | rSPSITE0ec2231d6929 elk: upgrade journalbeat and filebeat | ||
| D6634 | rSPSITE6ef2a7297f1f elk: upgrade elasticsearch and kibana nodes | ||
FWIW the main blocker for upgrading journalbeat is a change in the target mapping, which will need some adaptations in our log routing (between systemlogs and swh_workers), as well as, well, an updated mapping on the target indexes!
Thanks for the info.
For the record, the entry point of the upgrade process: https://www.elastic.co/guide/en/elastic-stack/current/upgrading-elastic-stack.html
Elasticsearch supports rolling upgrades between minor versions, from Elasticsearch 5.6 to 6.8, and from 6.8 to 7.15.1.
Upgrade the components of your Elastic Stack in the following order:
Elasticsearch Hadoop: install instructions
Elasticsearch: upgrade instructions
Kibana: upgrade instructions
Java High Level REST Client: dependency configuration
Logstash: upgrade instructions
Beats: upgrade instructions
APM Server: upgrade instructions
Elastic Agent: upgrade instructions
In order to validate the kibana upgrade, the kibana configuration can be copied locally with these commands:
docker run --rm -ti \
  -v /tmp/kibana_export:/tmp \
  elasticdump/elasticsearch-dump \
  --input=http://esnode1.internal.softwareheritage.org:9200/.kibana_2 \
  --output=/tmp/kibana_2.json \
  --type=data

docker run --rm -ti \
  -v /tmp/kibana_export:/tmp \
  elasticdump/elasticsearch-dump \
  --input=http://esnode1.internal.softwareheritage.org:9200/.kibana_2 \
  --output=/tmp/kibana_2_mapping.json \
  --type=mapping
Import:
# create the index
curl -XPOST http://10.168.100.61:9200/.kibana_2

# Import the mapping
docker run --net=host --rm -ti \
  -v /tmp/:/tmp \
  elasticdump/elasticsearch-dump \
  --input=/tmp/kibana_2_mapping.json \
  --output=http://10.168.100.61:9200/ \
  --type=mapping

# Import the data
docker run --net=host --rm -ti \
  -v /tmp/:/tmp \
  elasticdump/elasticsearch-dump \
  --input=/tmp/kibana_2_mapping.json \
  --output=http://10.168.100.61:9200/ \
  --type=data
cat > /tmp/alias.json <<EOF
{
  "actions": [
    {
      "remove": {
        "index": ".kibana_1",
        "alias": ".kibana"
      }
    },
    {
        "add": {
            "index": ".kibana_2",
            "alias": ".kibana"
          }
    }
  ]
}
EOF

curl -H'content-type:application/json' -XPOST http://10.168.100.61:9200/_aliases -d @/tmp/alias.jsonThe migration of ES can be performed with:
From: https://www.elastic.co/guide/en/elasticsearch/reference/7.15/rolling-upgrades.html
cat > /tmp/shard_allocation.json <<EOF
{
  "persistent": {
    "cluster.routing.allocation.enable": "primaries"
  }
}
EOF

curl -H'content-type: application/json' -XPUT http://10.168.100.61:9200/_cluster/settings -d @/tmp/shard_allocation.json{"acknowledged":true,"persistent":{"cluster":{"routing":{"allocation":{"enable":"primaries"}}}},"transient":{}}curl -XPOST http://10.168.100.61:9200/_flush/_synced
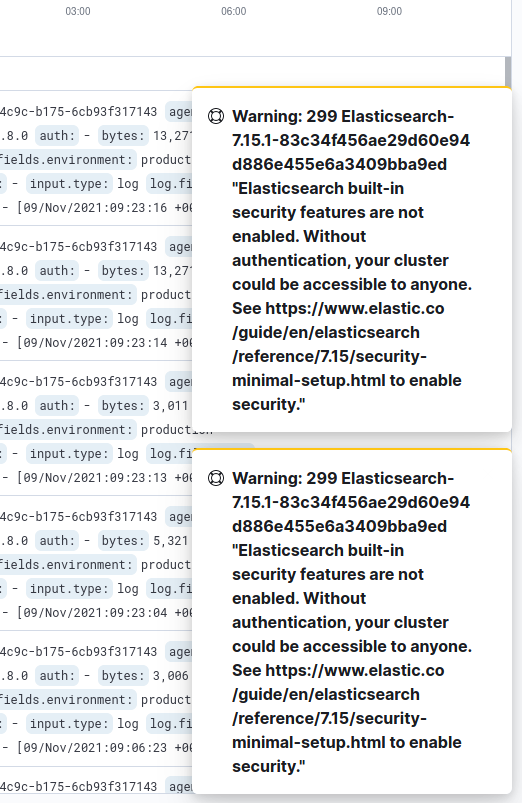
elastic::elk_version: '7.15.1'
elasticsearch::config::extras:
  xpack.security.enabled: false
The xpack configuration is needed to avoid the display of a warning popup each time a kibana search will be made in the recent version:
rm -rf /usr/share/elasticsearch/plugins/prometheus-exporter
cat > /tmp/shard_allocation.json <<EOF
{
  "persistent": {
    "cluster.routing.allocation.enable": null
  }
}
EOF

curl -H'content-type: application/json' -XPUT http://10.168.100.61:9200/_cluster/settings -d @/tmp/shard_allocation.json
It seems everything is still running well after the upgrade (logstash, filebeat, journalbeat)
To upgrade kibana, upgrading the version looks enough. The migration is automatically done and all the configured elements are still available:
root@esnode1:~# curl -s http://10.168.100.61:9200/_cat/indices\?v=true\&s=index | grep kibana
health status index                           uuid                   pri rep docs.count docs.deleted store.size pri.store.size
green  open   .kibana-event-log-7.15.1-000001 24Wb0rfUQuqab3Iody3Hrg   1   1          1            0     12.1kb            6kb  <-------- new index
green  open   .kibana-event-log-7.8.0-000001  6IjHICQVS2uX8qBekJLWsw   1   1          2            0     21.4kb         10.7kb
green  open   .kibana_2                       Oh9O6uB1R0-oNPbnhTM8kw   1   1       1928            3      1.5mb        788.4kb
green  open   .kibana_7.15.1_001              5fyk6NMUSE-3P6uhx-HSeg   1   1       1110           35      5.3mb          2.6mb  <-------- new index (automatically migrated from kibana_2)
green  open   .kibana_task_manager_1          vINZFVqCSJiDHHFMdYGwTA   1   1          5            0       32kb           16kb
green  open   .kibana_task_manager_7.15.1_001 pYeR_zFdTZO_jqxYS1DB9g   1   1         16          369      527kb        277.5kb  <-------- new index
root@esnode1:~# curl -s http://10.168.100.61:9200/_cat/aliases\?v=true\&s=index | grep kibana
alias                       index                           filter routing.index routing.search is_write_index
.kibana-event-log-7.15.1    .kibana-event-log-7.15.1-000001 -      -             -              true
.kibana-event-log-7.8.0     .kibana-event-log-7.8.0-000001  -      -             -              true
.kibana                     .kibana_7.15.1_001              -      -             -              -
.kibana_7.15.1              .kibana_7.15.1_001              -      -             -              -
.kibana_task_manager        .kibana_task_manager_7.15.1_001 -      -             -              -
.kibana_task_manager_7.15.1 .kibana_task_manager_7.15.1_001 -      -             -              -
Everything looks good with logstash 1:7.15.1
The monitoring of the logstash errors is still working as previously:
root@logstash0:/usr/lib/nagios/plugins/swh# ./check_logstash_errors.sh
OK - No errors detected
after closing the current system index:
root@logstash0:/usr/lib/nagios/plugins/swh# ./check_logstash_errors.sh
CRITICAL - Logstash has detected some errors in outputs errors=9 non_retryable_errors=13
The diff to prepare the migration of filebeat and journalbeat are ready. If everything is good after the review, the upgrade will be perform at the beginning of the W46.
To create the new mappings :
root@logstash0:/etc/journalbeat# journalbeat export template -E setup.ilm.enabled=false -E setup.template.name=systemlogs-7.15.1 -E setup.template.pattern='systemlogs-7.15.1-*' > /tmp/systemlogs-7.15.1.json
root@logstash0:/etc/journalbeat# curl -XPOST -H 'Content-Type: application/json' http://10.168.100.61:9200/_template/systemlogs-7.15.1 -d@/tmp/systemlogs-7.15.1.json; echo
{"acknowledged":true}
root@logstash0:/etc/journalbeat# journalbeat export template -E setup.ilm.enabled=false -E setup.template.name=swh_workers-7.15.1 -E setup.template.pattern='swh_workers-7.15.1-*' > /tmp/swh_workers-7.15.1.json
root@logstash0:/etc/journalbeat# curl -XPOST -H 'Content-Type: application/json' http://10.168.100.61:9200/_template/swh_workers-7.15.1 -d@/tmp/swh_workers-7.15.1.json; echo
{"acknowledged":true}The files are prepared on the /root of logstash0 in production
For the record, the upgrade of esnode[1-3] to bullseye is ok (in vagrant).
The upgrade is done without errors, puppet is green. A reinstall from scratch is also working well without warning.
for each node:
puppet agent --disable
for each node:
apt update
apt dist-upgrade

cat > /tmp/shard_allocation.json <<EOF
{
  "persistent": {
    "cluster.routing.allocation.enable": "primaries"
  }
}
EOF

curl -H'content-type: application/json' -XPUT http://192.168.100.61:9200/_cluster/settings -d @/tmp/shard_allocation.json

systemctl disable elasticsearch
systemctl stop elasticsearch # wait for the node to be removed from the cluster nodes
reboot

# The configuration manually updated (gc configuration) is not working with the new jvm 1.14 bundled with ES 7.15.2
mv /etc/elasticsearch/jvm.options /etc/elasticsearch/jvm.options-7.8.0
mv /etc/elasticsearch/jvm.options /etc/elasticsearch/jvm.options-7.8.0


puppet agent --enable
puppet agent --test

systemctl enable elasticsearch

cat > /tmp/shard_allocation.json <<EOF
{
  "persistent": {
    "cluster.routing.allocation.enable": null
  }
}
EOF

curl -H'content-type: application/json' -XPUT http://10.168.100.61:9200/_cluster/settings -d @/tmp/shard_allocation.json

# wait for the cluster to be green again and perform the upgrade of the next node